By Nicole Ibrahim
Hello reader,
Looking for a "new" Windows artifact that is currently being under-utilized and contains a wealth of information? Event Tracing for Windows (ETW) and Event Trace Logs (ETL) may be your answer.
Hello reader,
Looking for a "new" Windows artifact that is currently being under-utilized and contains a wealth of information? Event Tracing for Windows (ETW) and Event Trace Logs (ETL) may be your answer.
There's nothing new about them. They have existed for quite some time. However, their use from a forensics standpoint has been lacking. It's time to change that.
In this blog post we will cover what they are, where you can expect to find them, decoding ETL files, caveats associated with them and some interesting artifacts and forensically relevant data that ETL files can provide. Lastly at the bottom of this post you will find a link to our github repository for our python parser for ETLs.
ETW (Event Tracing for Windows)
ETLs or Event Trace Logs are ETW trace sessions that are stored to disk. Event Tracing for Windows was introduced in Windows 2000 and is still going strong up to Windows 10.
ETL files can contain a snapshot of events related to the state information at a particular time or contain events related to state information over time.
ETL files can contain a snapshot of events related to the state information at a particular time or contain events related to state information over time.
Triggered Events vs. Triggered Snapshots
Event Tracing is mainly used by Windows and application developers. For
example, Windows uses ETW for tracing the shutdown and boot processes
and application developers use ETW to debug their applications.
Some examples include:
It is enabled by default, but what is enabled and when it is enabled depend on varying factors including OS version and applications installed.
Windows uses ETW, but anyone can tap into the API or enable ETW sessions on demand and utilize event tracing including developers of Windows applications, IR, researchers, and adversaries. Refer to Microsoft's page for additional information about ETW.
Some examples include:
- Microsoft Office
- Windows Shutdown and Boot
- Windows SleepStudy
- Skype, Lync (Skype for Business) and OneDrive
- Power Efficiency Diagnostics
- Explorer Start up
It is enabled by default, but what is enabled and when it is enabled depend on varying factors including OS version and applications installed.
Windows uses ETW, but anyone can tap into the API or enable ETW sessions on demand and utilize event tracing including developers of Windows applications, IR, researchers, and adversaries. Refer to Microsoft's page for additional information about ETW.
Event Trace Logs (ETLs) are trace event sessions stored to disk. These files have the filename extension .ETL and will the main topic of this discussion.
ETL files stored to disk vary in their volatility and the data they contain. When a trace session is first configured, the settings used determine how log files are to be stored and what data is to be stored in them. Some logs are circular with old data being overwritten with new data when the max file size is reached, others have triggers that result in the contents of the log file being obliterated and starting fresh, and others have multiple log files for each instance that the event trace session flushed events to disk.
Windows stores information into ETL files when the system is shutdown, booted, a second user has logged into the system, when performing updates and more.
Microsoft Lync, Office, OneDrive, SkyDrive and Skype can also maintain their own ETL files containing debugging and other information.
The information contained within ETL files can be used in forensics for a variety of scenarios. Determining files that were previously existing but have since been deleted, Microsoft Lync contact status and other Lync information, connected WiFi networks and detailed information about them, services and applications running, system configuration information including physical and logical drive information, FileIO, DiskIO, Runkey information, and much more.
ETL File Locations
ETL files can be found practically anywhere on a Windows system. Some ETL files worth noting are listed below. These files have been observed as existing on most systems and can contain a great deal of information ripe for analysis. Some of these files will be explained in more detail later.
A link to a list of additional observed file locations can be found below. Note that this list is not all inclusive and there may be more locations not documented here.
Also, the existence of these ETLs on a system depends on many factors. Therefore, some of these files might not exist on the system you are analyzing. In research, some of the files were empty and others contained copious amounts of data.
Observed_ETL_File_Locations.xlsx
ETL Files
As previously mentioned, ETL files can be found in numerous locations on a Windows system and there may be hundreds of them, some empty and some containing data.Decoding ETL Files
How event data stored within ETL files depends on the trace logging technology used. More information about Microsoft's tracing technologies.
There are several Microsoft tools available for viewing/parsing ETL log files.
- Windows Event Viewer
- Microsoft Message Analyzer
- TraceView
- TraceFmt
- SvcTraceView
- Netmon
- PerfView
- Windows Event Viewer
- Microsoft Message Analyzer
- TraceView
- TraceFmt
- SvcTraceView
- Netmon
- PerfView
Windows Event Viewer is not only for EVTs and EVTXs, it can also read an ETL file. After opening an ETL in Event Viewer, you can save the ETL in various formats including as a CSV file.
However, depending on the type of ETL file, Event Viewer may not decode the event payload data and may not report event specific fields.
Microsoft Message Analyzer does a better job at decoding event data.
However, depending on the type of ETL file, Event Viewer may not decode the event payload data and may not report event specific fields.
Microsoft Message Analyzer does a better job at decoding event data.
If you wish to write your own tool in C# you can tap into the NuGet TraceEvent library to read events from an ETL file.
For python, a module named PyETW allows you to access Event Tracing for Windows. You can use PyETW to read events from an ETL file .
Decoding Issues
It is important to note that when decoding an ETL on a system that is not the source system, information needed to properly decode event data might not be available.
When an event provider is registered on a system, it also registers information needed to decode the event data. If the event provider is not registered on the system you are using to decode an ETL file, the tool will not be able to properly parse the events.
Also, some ETL files require a separate PDB (program debugging database) to decode events. Microsoft Message Analyzer has an option that allows PDBs to be downloaded and used to decode ETL files. However, some ETL files require private PDBs that are not available for download.
ETL File Volatility
As previously mentioned, trace events are not always written to disk. When an event trace session is configured, how the data is logged is also configured.
Ref: https://msdn.microsoft.com/en-us/library/windows/desktop/aa364080(v=vs.85).aspx
Event trace sessions that are configured to be circular will overwrite old events with new events when the max file/buffer size is reached. The old events that were overwritten are not recoverable. The WiFi.etl, BootCKCL.etl and ShutdownCKCL.etl files are examples of circular log files in testing.
Other event trace sessions can pre-allocate disk space and write events to disk when triggered. For example, Outlook when debug settings have been configured will write events to a log file when Outlook is closed.
For ETL files that use the new file option, when a maximum file size is reached a new file is created using an incrementing value as the new file’s name.
ETW and Live Monitoring
While this discussion focuses on offline forensics, there are numerous uses for ETW live monitoring.
In one example, a security research company published a proof of concept related to Logging Keystrokes with ETW.
Also check out Intrusion Detection with ETW for information related to using ETW for intrusion detection.
Interesting Logs and Events
The artifacts listed here just barely scratch the surface of what is stored within ETL files. Note that some logs mentioned in this section are not always present.
ShutdownCKCL and BootCKCL ETL Files
The ShutdownCKCL and BootCKCL are circular kernel context logs (CKCL) which contain information about the system that the event trace session knows at the time it was either shutdown or booted.
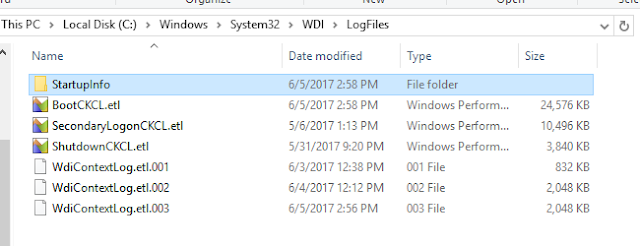
These log files are located in “%SystemRoot% \Windows\System32\WDI\LogFiles”.
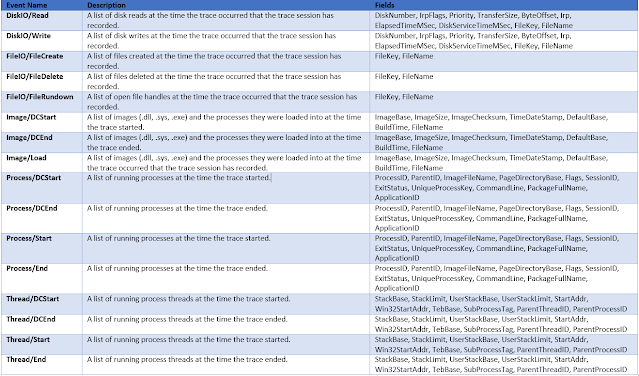
Interesting events worth noting:
Scenario: Determine Activity of a Malicious Tool during Boot
In this scenario we have a suspicious piece of software and we need to determine what information the trace session captured at the time the system was booted. The source system that the ETL file was collected from was a virtual machine running Windows 10 where a known virus was purposefully executed. Not long after execution of the virus, the system was booted and the BootCKCL file was collected for analysis.
The name of the software is “TuvtEkxir.exe”, it is known to be a malicious backdoor virus according to virus scans.
Using ETL Viewer, we can search for references to the executable.
In Figure 1: Search results containing TuvtEkxir, we can see there are multiple types of events related to our executable.
Figure 1: Search results containing TuvtEkxir
Looking into the FileIO/FileCreate we can see the location of the executable and an associated prefetch file.
Figure 2: FileCreate events for Virus
Next lets take a look at what DLLs were loaded by the software by looking into the Image/Load event. In Figure 3: Virus Loading DLLs, some of the DLLs are listed. Note “shell32.dll” and “netutils.dll”.
Figure 3: Virus Loading DLLs
Now let’s look at what disk reads were taking place. In Figure 4: Disk reads by virus, we can gather what file was being read, the offset, and the size of the read.
Figure 4: Disk reads by virus
Disk reads can be used to find out what section of the DLL or file was being read.
Energy NT Kernel Log
This log when present is located in “%SystemRoot%\ProgramData\Microsoft\Windows\Power Efficiency Diagnostics\energy-ntkl.etl”.
Interesting events worth noting:
Scenario: Determine Information about an attached external device
In this scenario, we will determine information about a WD My Passport drive that was connected to a Windows 2008 server using the energy-ntkl.etl file. In Figure 5: WD drive Physical Disk Information, the WD My Passport drive has been identified. Here we can gather the disk number, sector, track, cylinder and manufacturer information.
Figure 5: WD drive Physical Disk Information
Now that we know the disk number which in our scenario is 4, we can look into the event SystemConfig/LogDisk to gather more information. Here we can correlate the disk number, pull size information, drive letter, and free clusters.
Figure 6: WD drive Logical Disk Information
Next let’s determine the serial number, friendly name of the device, registry key, and other information. This can be found under the event SystemConfig/PNP. In Figure 7: PNP Information, we can correlate the friendly name to the manufacturer listed in Figure 5: WD drive Physical Disk Information.
We now have the registry key for this device, which also contains the serial number, vid, and the pid. The correlation can be tricky in scenarios where there are multiple entries with the same friendly name. In our scenario, there was only one device with the friendly name “WD My Passport 25E1 USB Device”.
We now have the registry key for this device, which also contains the serial number, vid, and the pid. The correlation can be tricky in scenarios where there are multiple entries with the same friendly name. In our scenario, there was only one device with the friendly name “WD My Passport 25E1 USB Device”.
Figure 7: PNP Information
Now that we have linked the information found within this ETL file, we now know the following about the WD external drive:
* Total bytes is calculated by BytesPerSector*SectorsPerCluster*NumberOfClusters
ExplorerStartupLog
This file appears to be created when the system boots. It is located in
C:\Users\<UserName>\AppData\Local\Microsoft\Windows\Explorer\ExplorerStartupLog.etl.
C:\Users\<UserName>\AppData\Local\Microsoft\Windows\Explorer\ExplorerStartupLog.etl.
There can be a large variety of events including ones that contain information related to ShellItems, network shares, applications requiring elevated privileges, and RunKey information. Also note that some of the events in this ETL can also be within the WDIContext
Interesting events worth noting:
In Figure 8: Some events in CDesktopFolder_ParseDisplayName/Start lists folders that were accessed on the 'D:\'. Note that the timestamp does not indicated when it was accessed. Instead it indicates the time the trace session recorded the events.
Figure 8: Events in CDesktopFolder_ParseDisplayName/Start
Location:
C:\Users\<username>\AppData\Local\Packages\Microsoft.Windows.Cortana_cw5n1h2txyewy\TempState\Traces\CortanaTrace1.etl
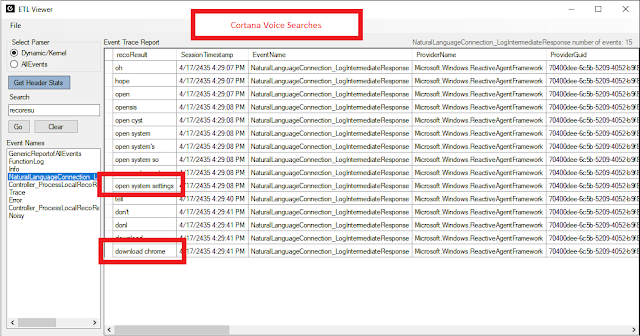
In the example below I had conducted two voice searches.
CortanaTrace
The CortanaTrace1.etl may also contain information of interest. Voice searches using Cortana have been observed in this ETL.Location:
C:\Users\<username>\AppData\Local\Packages\Microsoft.Windows.Cortana_cw5n1h2txyewy\TempState\Traces\CortanaTrace1.etl
In the example below I had conducted two voice searches.
Caveats
The timestamp field for event records does not necessarily indicate the time that an event occurred. Further research is needed to understand what the timestamp represents.
For example, for the BootCKCL.etl file, events listed in the FileIO/FileCreated category may or may not have been created at the time the system was booted and the timestamp represented for the event does not necessarily indicate that the file was created at that time. The timestamp instead indicates that this information was captured by the session at the time the trace was created.
ETL files can be volatile. Their volatility depends on how trace logging is configured for each session.
Tools that parse ETL files may not parse all the data including Microsoft specific tools. This is because the information needed to decode events are not always stored within the ETL file. For example, some ETL files use one or more PDBs (Program Debugging Databases) to decode events.
Tool Download
We have developed a command line tool that can parse multiple ETL files within a folder and output to a CSV and SQLite database.
https://github.com/gcpartners/ETLParser
https://github.com/gcpartners/ETLParser
Also Read: Daily Blog #386 - Exploring Extended MAPI


Post a Comment